
2022 Wrap-Up: Lightbox Mall Traffic Higher Than Ever
2022 WRAP-UP: LIGHTBOX MALL TRAFFIC HIGHER THAN EVER
Any notion that malls are still in recovery mode was put to bed in 2022. Remnant memories of lockdowns and capacity limitations are now miles in the country’s rearview mirror, once again making malls a top destination for shopping and socializing. The Lightbox (LB) mall network followed suit throughout the year, with consumers visiting our retail venues at rates higher than pre-pandemic.
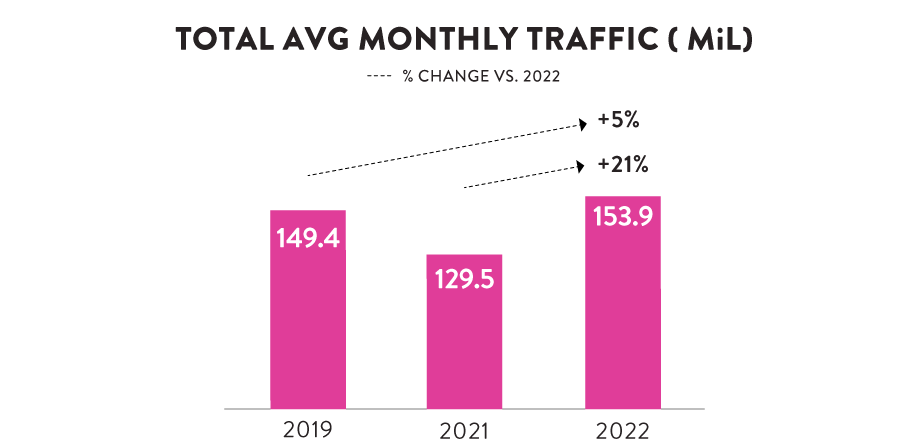
2022 Traffic 5% Higher Than 2019
Motionworks (formerly Intermx) reported that 2022 traffic to LB malls was stronger than ever, surpassing 2021 levels as well as pre-pandemic 2019. LB closed the year with mall traffic at +21% above YAG 2021 and +5% above 2019.
 Traffic Swells in Top Markets
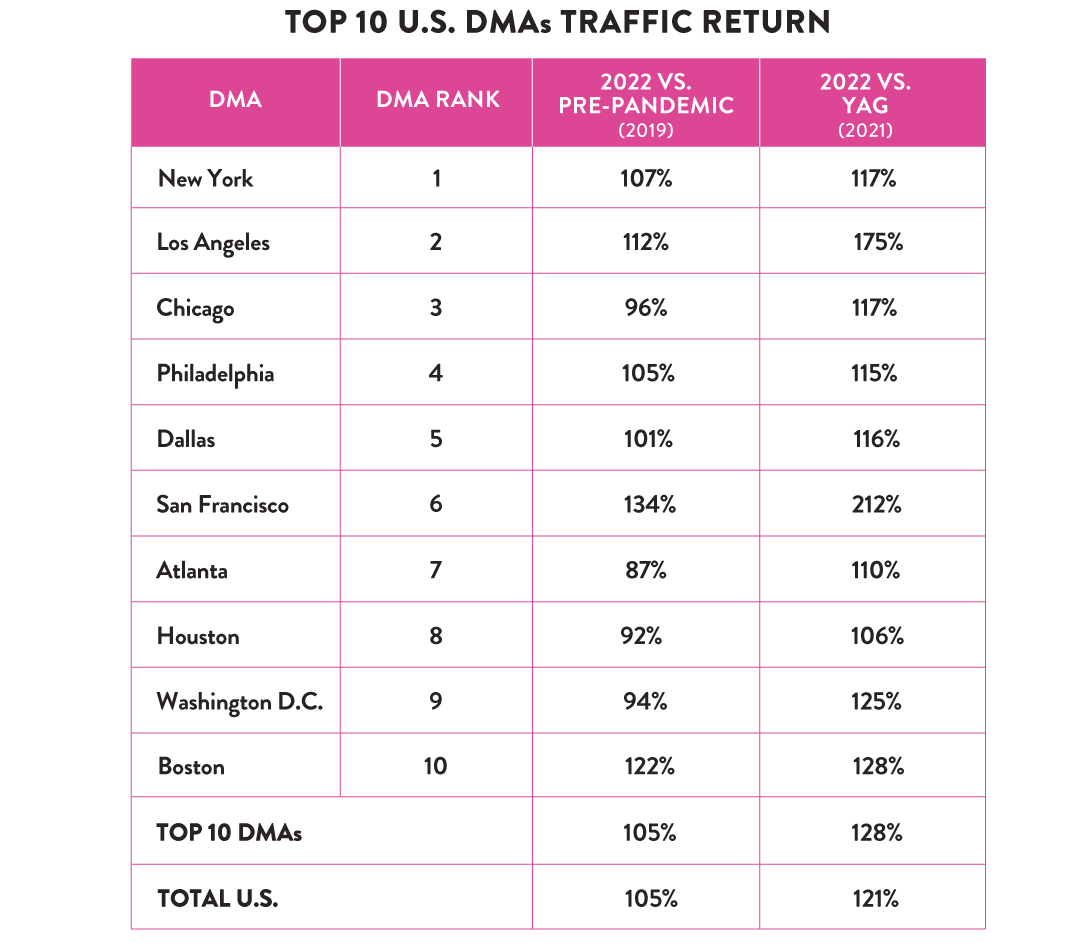
The Top 10 DMAs saw excellent mall traffic in 2022, exhibiting significant lifts compared to last year and 2019 (+28% and +5%, respectively).
The West Coast region led the pack, with Los Angeles traffic surpassing 2019 by +12% and San Francisco surpassing by +34%. Other top DMAs – like New York, Philadelphia, and Boston – also saw sizable traffic growth, ranging from +7% to +22% vs. 2019.
 The Holiday Traffic Gift Keeps On Giving
Despite economic slowdowns, recession fears, and a myriad of severe weather conditions, 2022 LB Holiday traffic saw a healthy bump of +38% vs. 2022 Non-Holiday timing. Compared to past Holiday seasons, 2022 saw a +2% lift vs. YAG 2021 and a +9% lift vs. 2019.
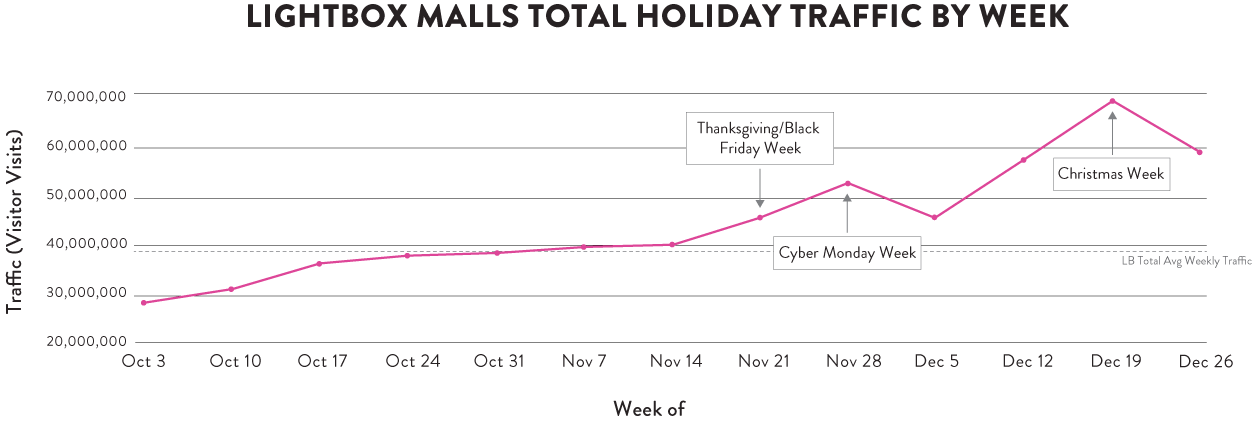
Consistent with industry projections, 2022 Holiday shopping started early and ended later for LB shoppers, with inflation concerns driving consumers to get a head start on gift deals.
LB Holiday traffic began as early as the week of 10/3 and continued upwards through Cyber Monday – averaging an +8% lift week-over-week from 10/3 to 12/4 – with Cyber Monday week’s traffic +29% above 2021 and +30% above 2019. After peak Cyber Monday traffic, visitors slightly dipped but then continued ascending through Christmas.
 Full Steam Ahead
Whether evaluating the top 10 markets, the holiday season or year-long averages, 2022’s record traffic to LB venues served as a strong indicator that Lightbox malls are filled with millions in audience, reachable through can’t-miss video advertising.
Sources: Motionworks. Mall traffic defined as total number of visitor visits who stayed at location for more than 15 mins for each visit, and excludes mall employees (defined as persons seen at the location for more than 4 days a week and spend more than 3 hours a day at location). Holiday & Non-Holiday Season definition: Holiday time period defined as Nov-Dec avg, Non-Holiday time period defined as Jan-Oct avg. Weather Source: NOAA (National Oceanic and Atmospheric Administration), Weather Nation
Press Contact
Zach Cohen
[email protected]